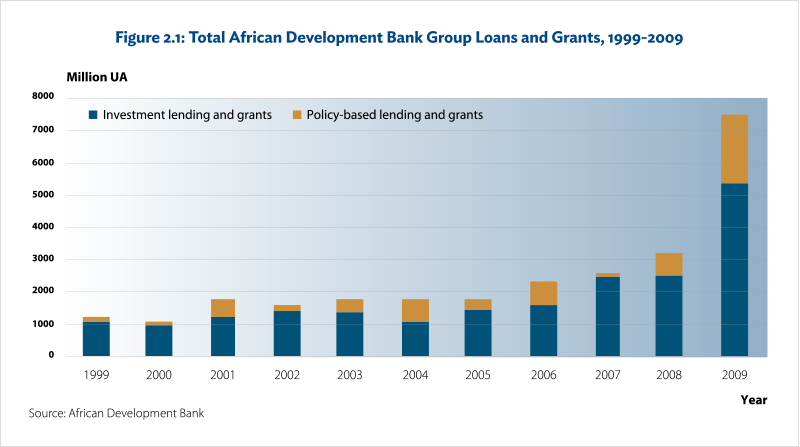
There has been a substantial increase in AfDB’s use of PBOs in terms of the number and amount of approvals since 2005. Between 2005 and 2008, AfDB’s total operations grew steadily before a spectacular increase in 2009, in response to the global financial crisis.16Operations Evaluation Department. 2011. Evaluation of Policy-Based Operations in the African Development Bank, 1999-2009. Abidjan: AfDB.Total PBO approvals over the 2005–2009 period amounted to UA6.1 billion, comprising UA3.6 billion in AfDB loans (21 operations), UA1.8 billion in AfDF loans (68 operations), and UA0.7 billion in AfDF grants (31 operations). A third of AfDB PBOs over the period were approved in 2009, accounting for 49%, by value, of the total AfDB PBOs approved during 2005–2009. One operation (Botswana Economic Diversification Support Loan) dominated the approvals, with a value of just over UA1 billion. The top five users of PBOs, by value, during the 2001–2009 period, were all MIC countries (Morocco, Botswana, Tunisia, Mauritius, and Egypt). Within active AfDF countries, more than half (20 out of 36) had PBOs, which accounted for over 20% of their total operations. In eight countries, PBOs represented 10%–20% of their operations, but in eight others less than 5% of their total AfDF financing was provided as PBOs. The largest AfDF users of PBOs, in terms of total finance provided, were Ethiopia, Tanzania, Ghana, and Mozambique, all of which received more than UA200 million over the 1999-2009 evaluation period. The AfDF countries with the largest number of separate operations were Tanzania, Burkina Faso, and Cape Verde (each with six); and Ethiopia, Mali, Zambia, Benin and Lesotho (each with five).

AfDB has approved 91 PBOs during the 2012–2017 period)17Independent Development Evaluation. 2018. Evaluation of Program-Based Operations in the African Development Bank, 2012-2017. Abidjan: AfDB.with an approval value of UA7.2 billion.18Operations Evaluation Department. 2011. Evaluation of Policy-Based Operations in the African Development Bank, 1999-2009. Abidjan: AfDB.Of the 91 approved operations during 2012–2017, 68% were part of a series of operations. This represents an increase on the period covered in the previous evaluation (1999–2009) in terms of both average annual approval volumes19AfDB, Operations Evaluation Department (2011).and the average number of operations approved per year.20Ibid.The PBO share of AfDB financing increased to 78% compared to 59% in the earlier period. For 2012–2017, disbursement stood at 95% of approvals at the time of writing. The remaining undisbursed funds were related to 2017 approvals.
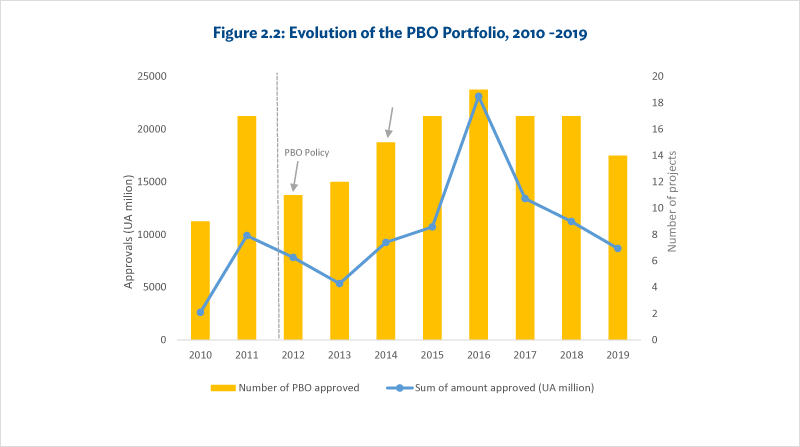
Since the approval of the 2012 policy, there was a steady increase in the number of operations approved until 2016 (Figure 2.2),21The 2011 evaluation included data only up to 2009, so data for 2010 and 2011 are also included to ensure there is no gap in longer-term approval data. when approval volumes spiked.22Three specific large approvals contributed to this spike: Algeria, Egypt, Nigeria As a result, in 2017 the Board and Senior Management agreed to introduce a ceiling of 15% for of AfDB operations for PBOs, which led to some PBOs planned for approval in 2017 being delayed or reconsidered and a decrease in approvals in 2017. The AfDF countries had a 25% PBO ceiling in place for the full evaluation period. The ceiling applies to the AfDF 3-year cycle, meaning that annual approvals fluctuate. In terms of other key portfolio trends as they relate to the direction pushed by the 2012 policy, there has been an increase in the proportion of PBOs which support sector governance, as opposed to only core public finance management (PFM) issues. Programmatic or multi-year operations now make up the majority of operations approved since 2012 (66%), with the remainder being SSOs.
Over three-quarters (by amount) of PBOs approved since 2012 have been for operations in MICs, although this translates to about one third in terms of the number of operations. The average size of PBOs is larger in MICs than in either LICs or transition states and larger in 2012–2017 than in 2010–2011. Over the same period, the average size of PBOs in LICs and transition states showed a slight decrease. The volume of PBOs provided as grants has also decreased and they accounted for just 6.1% in 2012–2017. In total, AfDB provided PBOs to 34 countries in Africa between 2012 and 2017. Of these, Morocco made the most use of AfDB’s PBO instrument, with 10 operations during that period.
Each country category was associated with a specific type of PBO. CRBS was predominant in transition states (75% of the total number), while GBS was most often used in LICs (68% of the total number). About half of SBS was directed at MICs (46% of the total number).
More recently, AfDB approved 33 PBOs in 24 countries between 2018 and 2020, amounting to more than UA1.9 billion. Reflecting previous trends, the largest amounts of PBOs were directed at MICs, including Morocco, Egypt, and Angola.

PBO = program-based operations, UA = unit of account (the currency for AfDB projects).
Note: The evaluation period is 2012–2017. The previous periods (2010–2011 and 2018–2019) were added for context and to complete the story of the evolution of the portfolio since the 2011 evaluation, which covered 1999–2009 approvals.
- 16Operations Evaluation Department. 2011. Evaluation of Policy-Based Operations in the African Development Bank, 1999-2009. Abidjan: AfDB.
- 17Independent Development Evaluation. 2018. Evaluation of Program-Based Operations in the African Development Bank, 2012-2017. Abidjan: AfDB.
- 18Operations Evaluation Department. 2011. Evaluation of Policy-Based Operations in the African Development Bank, 1999-2009. Abidjan: AfDB.
- 19AfDB, Operations Evaluation Department (2011).
- 20Ibid.
- 21The 2011 evaluation included data only up to 2009, so data for 2010 and 2011 are also included to ensure there is no gap in longer-term approval data.
- 22Three specific large approvals contributed to this spike: Algeria, Egypt, Nigeria
